👕thredUP: Resale Goes Mainstream👕
For years, PETITION has been covering the emergence of resale as a new and growing retail category (see here, here, here and here). If VCs can write self-aggrandizing social media posts whenever one of their investments goes public, surely we can take a small victory lap too. On March 3, 2021, thredUP Inc. (“thredUP”) filed its S-1 ahead of an IPO. The S-1 allowed us to dig deep into a major player in the resale market.
thredUP claims to be one of the world’s largest online resale platforms for second-hand women’s and kid’s apparel, shoes and accessories. Founded in 2009, the business currently boasts 428,000 Active Sellers and 1.24 million Active Buyers who come to the platform to find items at an up to 90% discount to their estimated retail price. thredUP claims its platform is loved by both parties; buyers love shopping value, premium and luxury brands all in one place, while sellers love the convenience of unlocking value for either themselves or the charity of their choice. thredUP sees a huge opportunity in the resale market — according to the GlobalData Market Survey, the resale market is expected to grow from $7b in ‘19 to $36b by ‘24, representing a compound annual growth rate of 39%.
How Does thredUP’s Business Work?
thredUP’s entire end-to-end chain works as follows:
A seller signs up for thredUP and orders a Clean Out Kit. She fills thredUP’s ‘Clean Out Kit’ with items from her closet that no longer spark joy:
Sellers on thredUP’s platform benefit from an extremely low touch platform: thredUP essentially does all the work. The seller’s only decision to make prior to shipping their clothing is whether they want to sell their clothing for cash, store credit, or donate the proceeds to charity. Once that decision is made, the seller fills the Clean Out Kit bag and leaves it on their doorstep for a mail carrier pick up, or drops it off at a retail or logistics partner location for shipping, free of charge. Once the items are shipped, the seller’s work is finished. thredUP’s proprietary platform manages item selection and pricing, merchandising, fulfillment, payments and customer service. thredUP uses an internal software algorithm to “predict the demand for an item and determine a listing price for it, along with setting the seller payout ratio, with the aim of optimizing sell-through, gross profit dollars and…unit economics.” Seller payout ranges from 3% to 15% for items listed at $5.00 to $19.99, and up to 80% for items listed at $200 and above. For the year ended 12/31/20, that resulted in an average seller payout of 19% of the item sale price with an average seller payout per bag of $51.70. thredUP is clearly working with small dollars, but on significant volume.
Harvard Business School covered thredUP’s origins as “a peer-to-peer online clothes sharing site for adults.” In the words of co-founder and CEO James Reinhart, “It was a great story. And a bad business…Customer adoption and use of the product wasn’t nearly what we had hoped.” In 2009, acceptance of secondhand clothing was not mainstream. In 2012, thredUP pivoted to the children’s market. Per Mr. Reinhart, “[thredUP] realized there was a huge opportunity in kids because there’s the forced obsolescence of kids’ clothing.” thredUP was able to scale the business quickly from less than 20,000 adults to more than 300,000 parents, adding at a rate of 500 to 1,000 per day. thredUP discloses in its S-1 that the company shifted again in mid-2019, de-prioritizing its product sales in favor of consignment sales. As thredUP’s S-1 indicates, consignment may be a vastly superior retail business model. Per the S-1:
“We believe that operating primarily on consignment also gives us the ability to drive stronger future margins than traditional inventory-taking business models because we incur minimal inventory risk and benefit from favorable working capital dynamics. Our buyers pay us upfront when they purchase an item. For items held on consignment, after the end of the 14-day return window for buyers, we credit our sellers’ accounts with their seller payout. Our sellers then take an average of more than 60 days to use their funds.”
In other words, thredUP presumably derives a kind of “float” benefit as well, generating interest income off of that 60-day average. In addition to those positives, thredUP preserves a degree leverage over its sellers. Once a customer ships its items to thredUP, thredUP can decide which goods will ultimately be passed through to the marketplace, and at what price they will be listed at, therefore locking in platform product quality and margin.
thredUP - A Contrarian Strategy
In a letter to potential shareholders, Mr. Reinhart outlines the criticism thredUP faced from its earliest days:
“Since the earliest days of thredUP, we have been told that our strategy was contrarian. That our commitment to cracking the hardest infrastructure, supply chain and data challenges in the service of a better customer experience was risky or could lead to failure. “Touching things” is hard. “Low price points” are hard. “Single SKUs” is just plain crazy. Yes...We are doing the hard things that meaningfully expand this opportunity and enhance our leadership position. I have been willing to be misunderstood and even underestimated in taking this approach, driven by my belief that businesses that are harder to build in the short-term can have extraordinary long-term impact.”
In its S-1, thredUP outlines various proprietary technologies and processes it utilizes to execute its “contrarian” strategy. thredUP operations are “purpose-built for “single SKU” logistics, meaning that every item processed is unique, came from or belongs to an individual seller, and is individually tracked….” As there are no barcodes on clothing, moving all these unique SKUs can only be accomplished through technology. thredUP’s technological aids cover i) visual recognition of items, ii) supply acceptance and itemization, iii) pricing and merchandising, iv) photography, and v) storage and fulfillment.
Photography is one of the largest and most expensive pain points when prepping an item for online sale. thredUP claims it “utilizes machine learning and artificial intelligence” and “software that automatically selects the optimum photo to drive buyer engagement…[a] specialized photo selection capability” which enables thredUP to produce hundreds of thousands of high-quality photos a day without a professional photographer.
As Mr. Reinhart alludes to in his letter, one key to managing thredUP’s volume is reliable distribution. thredUP has leased five different distribution centers in Arizona, Georgia, and Pennsylvania, with total capacity of 5.5 million items (the company has plans to expand that to 6.5 million by the end of 2021). On current capacity, thredUP has the ability to process more than 100,000 unique SKUs per day. thredUP’s engineering team has developed and implemented automation technology, which the company believes results in reduced labor and fixed costs while increasing storage density and throughput capacity. thredUP also claims their software matches buyers to the closest distribution center, while personalizes the assortment potential buyers they see on the marketplace to items that are physically closest to them. This geographical personalization enables buyers to find items that are lower priced (the closer the item, the lower the price) and more likely to arrive quickly. Underlying all this is thredUP’s trove of data. thredUP’s business captures large volumes of data from touch points throughout the resale process, including transactional and pricing data from brands and categories, as well as behavioral data from buyers and sellers, which is fed directly into thredUP’s pricing algorithm.
thredUP’s website is a disruptive model which dramatically improves the resale shopping experience for both buyers and sellers. thredUP believes resale is on pace to overtake the traditional thrift and donation segment by 2024. For buyers, thredUP offers depth of selection and ease of browsing. The company claims it lists an average of more than 280,000 new secondhand items each week, with 35,000 brands across 100 categories and across price points. There’s no question thredUP offers a dramatically improved shopping experience versus traditional brick & mortar thrift stores. In comparison to traditional thrift stores where buyers sift through reams of clothing, thredUP undergoes a “rigorous twelve-point quality inspection” which they believe prevents low-quality items from being listed. In the S-1, the company discloses that only 59% of the items it received from sellers were listed on the marketplace after curation and processing. thredUP offers evidence this quality inspection produces results: of thredUP’s 12% return rate for total items sold, returns due to poor item quality accounted for less than 2%.
Per thredUP’s market report, online thrifting growth estimates are dramatically outperforming both brick & mortar thrifting as well as broader retail.
The Growth of Thrifting – Illustrated

In 2019, resale grew 25x faster than the broader retail sector…

…a growth trend that was aided by COVID, as shoppers found value and entertainment in thrifting…

Secondhand retail is taking market share…
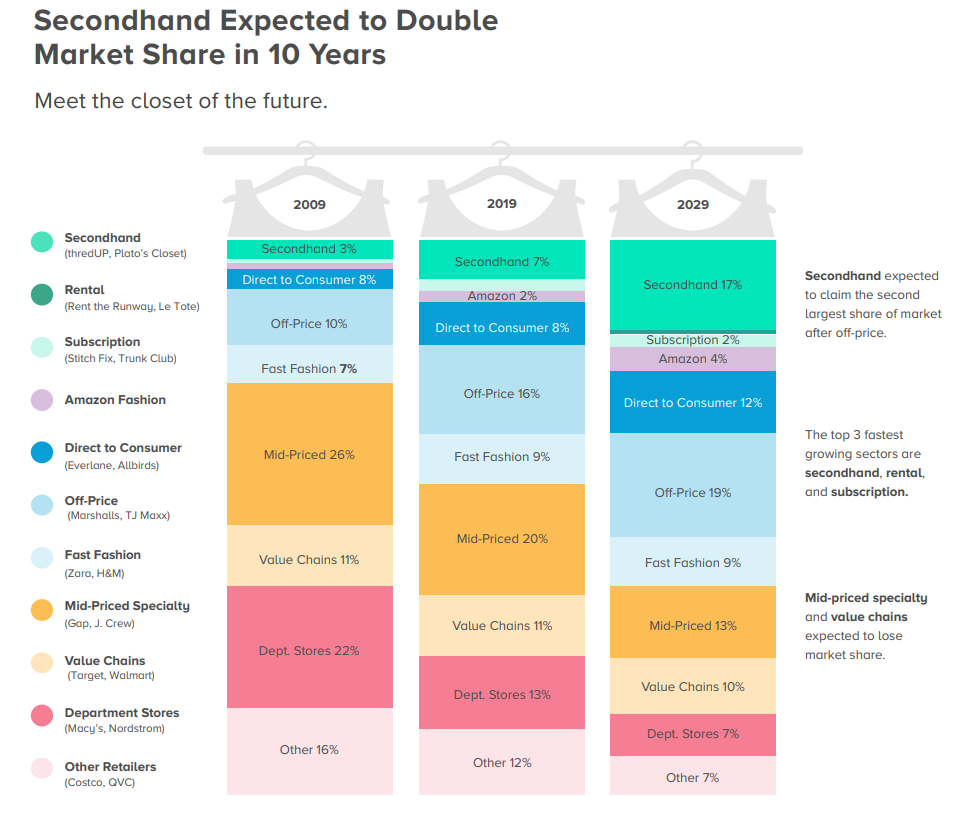
…fueled in part by celebrities who believe secondhand is the future of retail.

Thrift is now mainstream, and thredUP’s new brand image is treating it as such:

thredUP’s brand pivot along with commentary by Mr. Reinhart was featured in an October 2020 CSA article:
“The perception of thrift has changed. Consumers are not only open to shopping secondhand, but they are wearing it proudly. ThredUP’s brand evolution acknowledges this shift from stigma to status, and celebrates our community of thrifters who are thinking secondhand first.”
thredUP - What’s the Risk?
If thredUP is a retailer with uniquely positive dynamics that also plays in an ESG-positive part of the consumer market that’s growing tremendously among Millennials and Gen Z, what’s the risk in this business model?
To start, cash flow out of the gates isn’t great:

Source: PETITION LLC
On a CFO – CapEX basis, thredUP burns more than $38mm of cash per annum. Taking a look at the income statement, thredUP’s Operating Expenses have been growing at a faster rate than Sales.

Source: PETITION LLC
Part of that slowdown may be due to the company’s forced revenue mix shift towards a consignment model. But COVID certainly didn’t help. thredUP notes that gross profit dollar growth and average contribution profit per order in 2020 both were lower than company estimates as a result of its COVID-19 response, which included higher levels of discounts and incentives and higher fixed costs per order. A Glossy interview with Fashionphile founder Sarah Davis indicated that resalers weren’t immune to lockdown-driven retail woes:
“According to Sarah Davis, founder of the Neiman-Marcus-invested resale platform Fashionphile, sales dipped considerably in March, but have risen each week in April, rebounding by more than 300% so far; sales are on track to be back at pre-coronavirus levels by May. But product from sellers has slowed to a standstill for a simple reason: Sellers don’t want to bring their bags of unwanted pieces to the post office while quarantined.
“Like all resellers, we are supply-constrained,” Davis said. “When things closed down, we thought people would have nothing better to do and use the time to clean out their closets. And that’s true. But the actual process of getting the product is the much harder task. Acquiring new product came to a crashing halt when we closed our warehouse [in March], which made it impossible to receive new product and really hard to process product that had already come in. And once it was back open, it was still hard to get people to go the post office to drop things off. So people had product they wanted to get rid of, but no way to get it to us. That was the big problem to solve.”
Whether thredUP’s logistics network is truly a groundbreaking, competitive advantage is up for debate. For one, the company doesn’t own its distribution centers and cannot guarantee supply, which in a space as competitive as resale may be problematic. Ms. Davis’ comments are telling:
“Luxury resale will always be supply-constrained,” Davis said. “People will always buy a Dior bag at a reduced price; the hardest thing is keeping the supply coming. It’s honestly a miracle that we have 20,000 items on the site, but each one of them came from individual people, so we absolutely need people to keep selling to us, whether it’s individual customers or even small business resellers, which sell to us sometimes. I would bet that for any reseller right now, the seller is where their focus is.”
A core strength of companies such as Amazon.com, Inc. ($AMZN) and recent IPO Coupang Inc. ($CPNG) is their logistics networks, which serve their customers quickly and efficiently. thredUP appears to be on the verge of successfully disrupting brick and mortar thrift. However, thredUP’s competition is fierce, including publicly traded resellers such as The RealReal Inc. ($REAL) and Poshmark Inc. ($POSH). The winner in the space is likely to be the reseller that best manages the supply constraint, and is able to create a friction-free environment for buyers and sellers. Logistics is the lynch pin of the resale business.
However, thredUP’s business model does differentiate it from other resale platforms. For example, thredUP’s total active management system is ideal for sellers who want a zero touch experience. This is a sharp contrast to Poshmark, which enables a seller to effectively run their own e-commerce consignment storefront. On Poshmark, sellers upload their own photos of the items they want to sell and determine their own pricing. These sellers can also leverage social media followings to drive sales.
Regardless of which platform is in vogue, we continue to think resale is a retail trend that has legs. Every dollar that goes into retail is coming out of online fast fashion like Zara Industria de Diseño Textil, S.A. ($IDEXF) and H & M Hennes & Mauritz AB ($HM-B.ST) or brick and mortar. Resale’s mainstream acceptance is being fueled by sustainability motives and endorsed by both celebrities and trendsetting, high fashion brands. Retail platforms are engaging with resale platforms like thredUP to explore new cross-selling opportunities. These drivers are accelerating growth. In its 2018 resale report, thredUP estimated the resale market to grow at a 15% annual CAGR from 2017 - 2022. In the 2020 resale report, the resale market is now expected to grow at a 39% CAGR from 2019 - 2024. If these estimates hold up, the HBS case studies of thredUP will need to be rewritten again to incorporate the foresight of its founders and a business ahead of its time.
And the narrative that brick and mortar retail destruction starts and stops with Amazon will need to become more inclusive of other factors. Just like we’ve been arguing since our inception.
